Rusu Adrian`s

Data Analysis/Science Portfolio showcasing my projects

Explore my data analysis projects, blogs, and personal insights into the world of data.

My Projects

Explore my data analysis projects with screenshots and detailed entries.

A computer screen displaying analytics dashboards with various charts, including a line graph on the left and a cohort analysis table on the right. The table is populated with different shades of blue, indicating varying levels of user activity over several weeks. Text labels and numbers detail user retention statistics.
Data Analysis Projects

Dive into my extensive portfolio showcasing data analysis projects across various sectors, complete with insightful screenshots and comprehensive databases to enhance understanding and visualization of my work.

A computer screen displaying a data analytics dashboard with graphs and charts. A blue line graph shows fluctuations in data over time, and a section highlights the number of page views. A pie chart is partially visible, indicating a breakdown of different data elements.
Blog Insights

Check out my blog for valuable insights and tips on data analysis, enhancing your knowledge and understanding of best practices and innovative approaches in the field.

About me

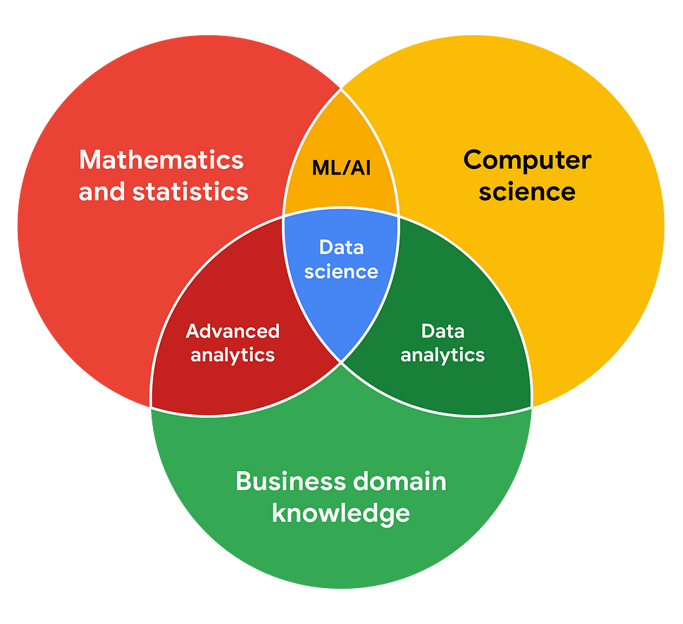
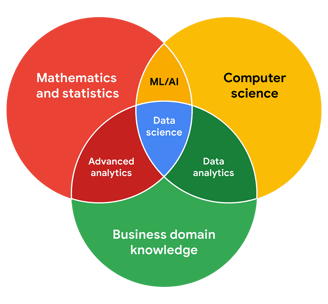
I'm currently diving deep into the exciting worlds of data analysis and data science. I'm passionate about uncovering insights from data and learning how to use its power to tell compelling stories and solve real-world problems. I'm constantly exploring new tools and techniques, and I'm excited to share my learning journey and future projects with you.

Explore my journey through various data analysis projects showcasing skills, creativity, and dedication to innovative solutions. Each project highlights unique challenges and effective strategies in the dynamic world of data.

Gallery

A laptop displaying a financial dashboard with various stock market graphs and data. The screen shows different stock indices and their performance, including line charts and a bar chart for market overview. The laptop is placed on a light-colored table, and a gray sofa is visible in the background.
A laptop displays a detailed financial chart with lines showing data trends. In the background, a person is partially visible, wearing a dark shirt with the words 'most valuable' and some logos printed on it. The setting appears to be a modern workspace.
Hands typing on a laptop keyboard with a screen displaying financial graphs and stock market data. Multiple charts and numbers are visible, indicating online trading or financial analysis.
A person is looking at a computer screen displaying a document titled 'Overview - All Private Equity - Fundraising, Investments, & D'. The document contains statistical charts and graphs related to private equity market statistics from 2007 to 2022. Various tabs and functions like 'File', 'Home', 'Insert', and 'Design' are visible in the interface.
A laptop displaying a line graph with various peaks and troughs on its screen, indicating stock or financial data. The graph and numbers are green against a black background. The laptop is placed on a wooden table, and beside it, a person's arm is partially visible.
A digital screen displaying analytical data with line graphs, histograms, and numerical values. The data is presented in a user-friendly interface with different shades of blue used to distinguish various elements.

Explore my data analysis projects through engaging visuals and insights.